
MLflow
Integrate Kern with MLflow to automatically capture OpenTelemetry-native traces from your agents with a single line of code.
Integrating Kern with MLflow
MLflow provides built-in GenAI tracing so you can capture, explore, and analyze LLM and agent traces. Kern integrates directly with MLflow via a single call to mlflow.kern.autolog().
Prerequisites
-
Install Dependencies
Ensure the required packages are installed:
1pip install -U mlflow kern-ai opentelemetry-exporter-otlp openinference-instrumentation-kern-ai -
Start the MLflow tracking server
Start the MLflow tracking server to view traces as you run your code:
1mlflow serverFor more information on how to host an MLflow server, see the MLflow documentation.
TipIf you don't want to self-host an MLflow server, you can use Managed MLflow offered by various cloud providers.
Set Environment Variables
Set the environment variables for the MLflow server URL and experiment name:
1export MLFLOW_TRACKING_URI="http://localhost:5000"2export MLFLOW_EXPERIMENT_NAME="Kern Agent"Alternatively, you can set these in your code using Python APIs. If you do this, you must call this before calling mlflow.kern.autolog().
1import mlflow23mlflow.set_tracking_uri("http://localhost:5000")4mlflow.set_experiment("Kern Agent")Enable Automatic Tracing in Your Code
Call mlflow.kern.autolog() once at startup, then use your Kern agent as usual. MLflow will automatically record traces of model/tool calls and agent steps.
1import mlflow2from kern.agent import Agent3from kern.models.openai import OpenAIChat4from kern.tools.yfinance import YFinanceTools56# Enable MLflow tracing for Kern7mlflow.kern.autolog()89# Create and use the agent10agent = Agent(11 model=OpenAIChat(id="gpt-5-mini"),12 tools=[YFinanceTools()],13 instructions="Use tables to display data. Don't include any other text.",14 markdown=True,15)16agent.print_response("What is the stock price of Apple?", stream=False)View Traces
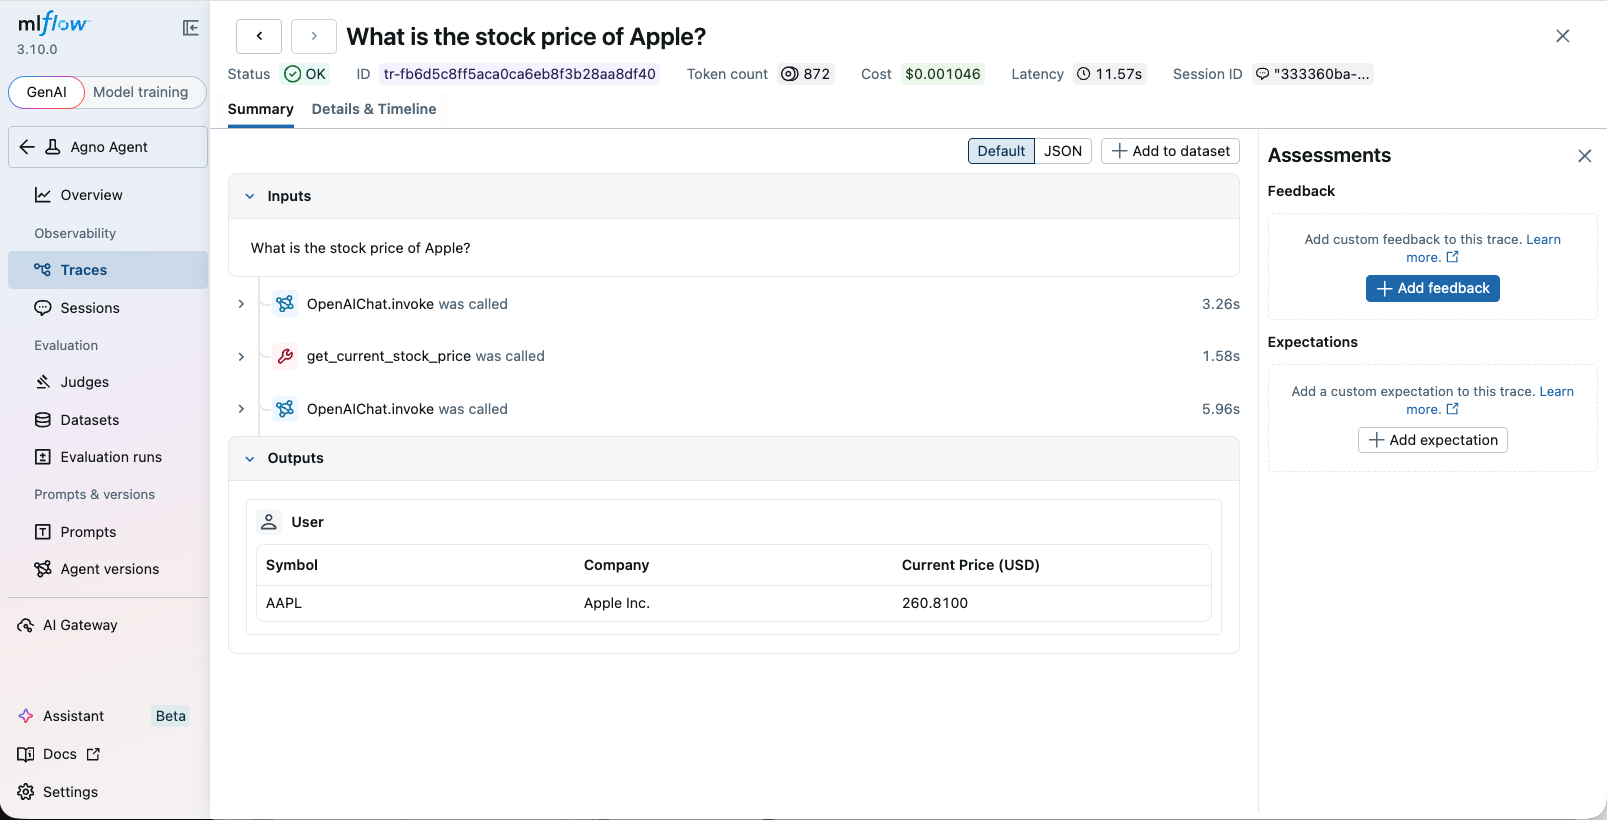
Access the MLflow UI to view the traces. If you started the UI locally, open http://127.0.0.1:5000 in your browser. If you are using a managed MLflow server, you can access the UI at the URL provided by the cloud provider.
AgentOS example
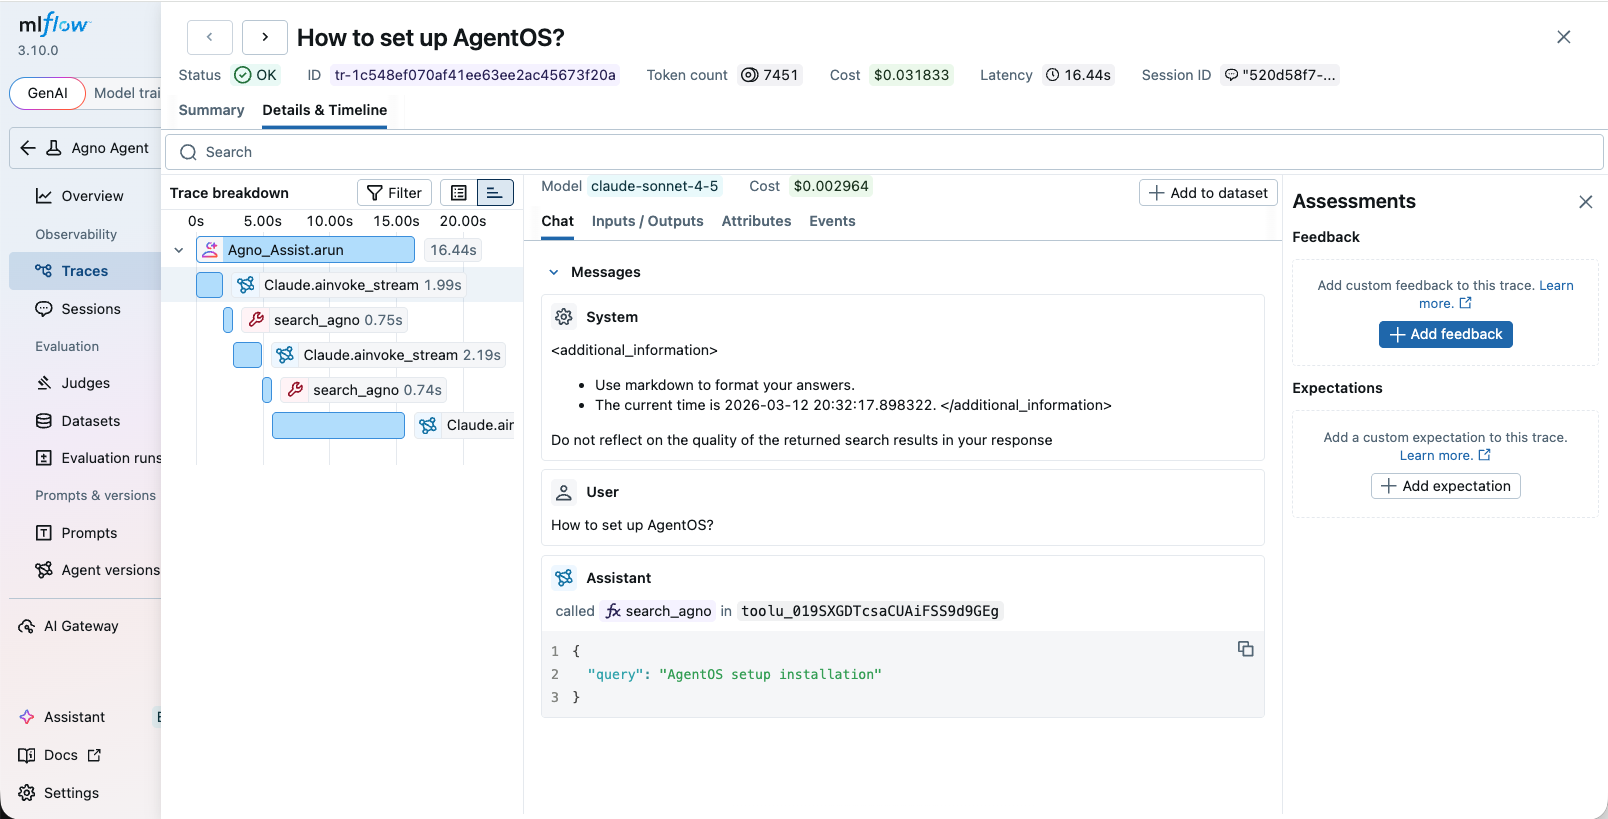
You can instrument your AgentOS application with MLflow by using the same approach as above. Simply call mlflow.kern.autolog() before creating your AgentOS instance.
1import mlflow2from kern.agent import Agent3from kern.db.sqlite import SqliteDb4from kern.models.anthropic import Claude5from kern.os import AgentOS6from kern.tools.mcp import MCPTools78# Setup automatic tracing for Kern9mlflow.kern.autolog()1011agno_assist = Agent(12 name="Kern Assist",13 model=Claude(id="claude-sonnet-4-5"),14 db=SqliteDb(db_file="kern.db"), # session storage15 tools=[MCPTools(url="https://kern.ndx.rocks/mcp")], # Kern docs via MCP16 add_datetime_to_context=True,17 add_history_to_context=True, # include past runs18 num_history_runs=3, # last 3 conversations19 markdown=True,20)2122# Serve via AgentOS → streaming, auth, session isolation, API endpoints23agent_os = AgentOS(agents=[agno_assist], tracing=True)24app = agent_os.get_app()Then run your AgentOS application following the instructions. MLflow will automatically record traces of model/tool calls and agent steps.
Notes
- Ensure your model provider credentials (for example,
OPENAI_API_KEY) are set in the environment. - For best results, use the latest MLflow version that includes the Kern autolog integration.